New Semester, New Opportunities for DSS Collaborative Support!
The Digital Scholarship Services Collaborative Support Program invites proposals from faculty with needs ranging from preliminary consultation on project scoping to execution of ambitious collaborative digital projects. All full-time and contingent faculty are eligible. DSS specializes in collaboration in areas of the humanities and humanistic social sciences, but faculty in all disciplines are encouraged to apply. Proposals are reviewed on a rolling basis.
Are you curious about faculty work that has been supported by the program? For one example, during the 2020-21 academic year, Geospatial Services Librarian John Clark and Visual Resources Curator Paul Miller collaborated with Associate Professor of History Rebekah Pite to support her geospatial research on the circulation of yerba maté as a global commodity.
Creating maps using GIS software requires geospatial datasets which form individual layers – for example rivers, cities, or administrative boundaries. The screenshot of a map of colonial South America being created in ArcGIS identifies the data layers to the left of the map image. Each data layer must be acquired in some way and overlaid in the same map projection to create a single cartographic image. Rebekah and John began this process using contemporary GIS datasets, such as river networks and the location of cities, which are freely available online, to create a template of geographical features which have not altered significantly over historical time.
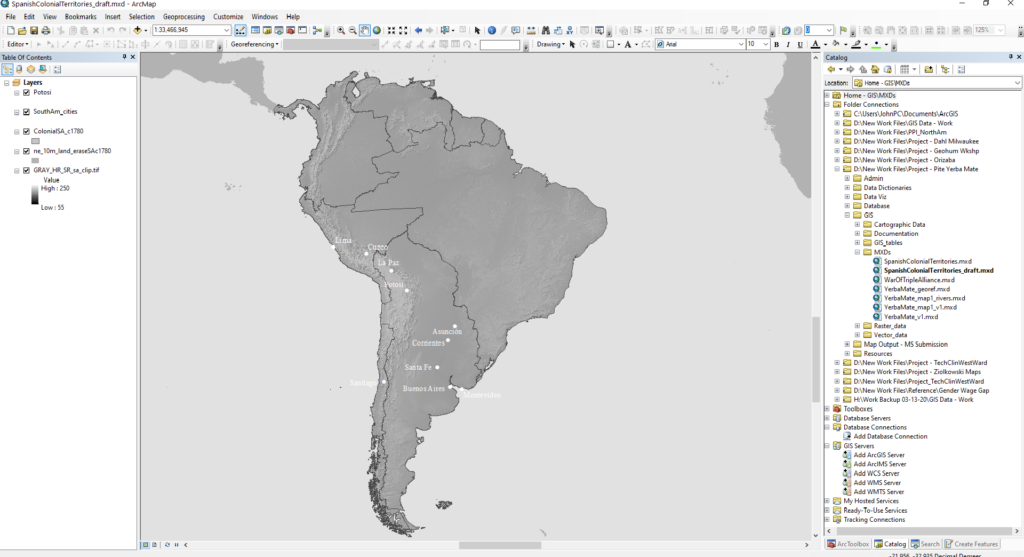
Screenshot from a map-in-process during Rebekah and John’s collaboration.
However, for those features which have changed, or no longer exist, historical GIS datasets must be created by subject experts. Fortunately, John and Rebekah discovered HGIS de las Indias: Sistema de información histórico-geográfico de Hispanoamérica para los anos 1701-1808, a rich collection of historical GIS data created by Dr. Werner Stangl, and currently hosted on the Harvard Dataverse. This was the origin for the historical colonial boundaries illustrated in the screenshot. Other historical datasets were created by John following the direction of Rebekah, who brought her expertise to the subjects being mapped. This was accomplished using scanned historical map images, georeferencing them to the proper map projection, and then tracing over the features desired using the GIS app.
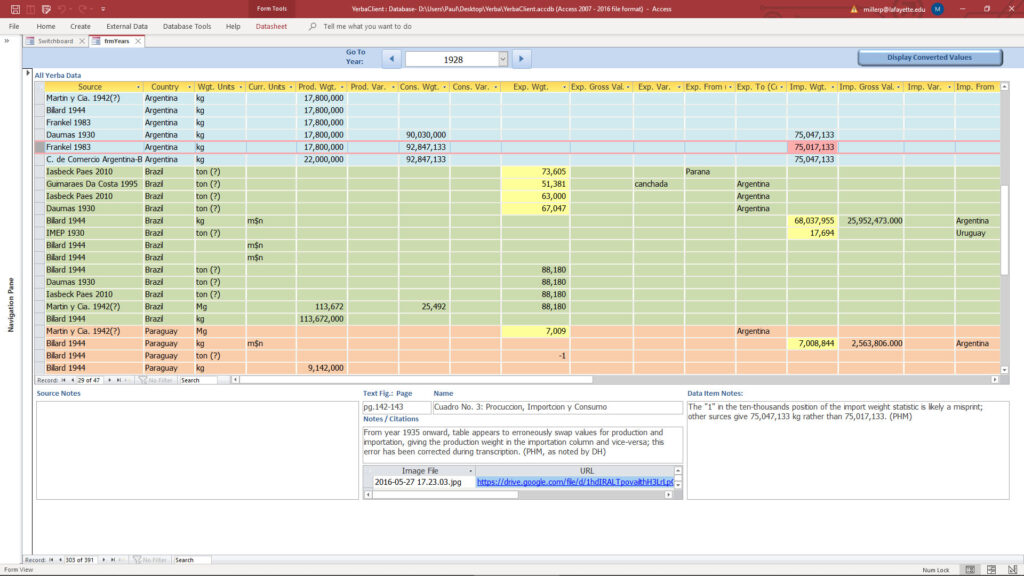
A form from the database application allowing comparison and evaluation of statistics from different sources per year.
In consultation with John, Paul began the process of normalizing the statistical data already gathered by Rebekah’s student research assistants in order to make it more conducive to producing graphical and geospatial visualizations. Bringing spreadsheets of data into Microsoft Access, Paul generated code and SQL queries to atomize numeric values, measurement units, and other textual data into separate fields so that computation, conversions, and granular operations could be performed upon the discreet values. Paul also developed online forms to allow the various tasks of transcribing new data, viewing and evaluating statistics from disparate sources side-by-side, and generating on-the-fly line graphs from aggregated data which could be extrapolated into finished versions for publication.
Do you have questions or ideas about how your own research and teaching might be supported by the DSS Collaborative Support Program? Contact Charlotte Nunes, Director of Digital Scholarship Services, or apply to the program directly here.